This variance finder will give you the number of samples, mean, standard deviation, and variance in one click. Using this variance calculator with steps, you will get step-by-step results of standard deviation, mean, and variance.
Variance calculator is an online free tool to calculate the variation of each number in a data set from the mean value of that data set. You can use this tool to understand and solve complex and lengthy variance problems.
What is Variance?
In statistics, the variance of a random variable is the mean value of the squared distance from the mean. It shows the distribution of the random variable by the mean value.
A small variance indicates the distribution of the random variable close to the mean value. If the variance is greater, it shows that the random variable is far from the average value.
For example, the narrow bell curve has a small variance in the normal distribution, and the wide bell curve has a large variance.
Variance Formula:
The population variance of a finite size N population is calculated using the following formula:
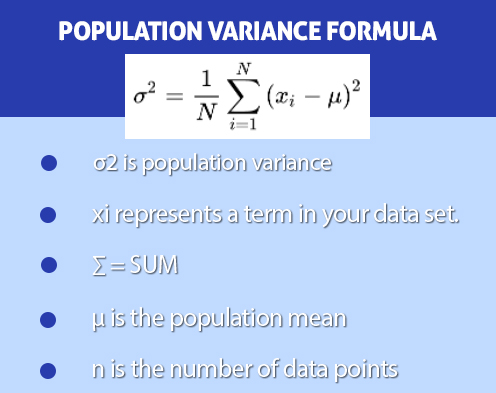
Population Variance \(=\sigma^2 = \dfrac{1}{N}\displaystyle\sum_{i=1}^n (x_i - \mu)^2 \)
In this equation, σ2 refers to population variance, xi is the data set of population, μ is the mean of the population data set, and N refers to the size of the population data set.
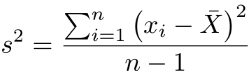
The following formula is used to calculate the sample variance.
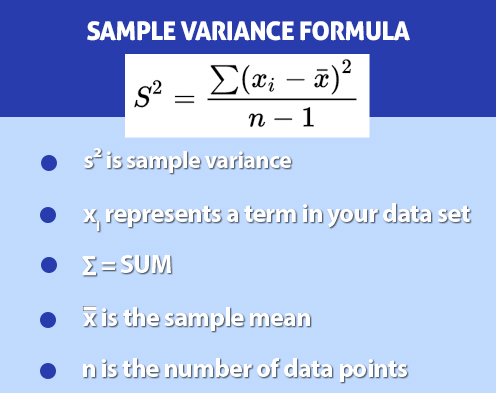
Sample Variance \(=\ s^2 = \dfrac{1}{N-1} \displaystyle\sum_{i=1}^n (x_i - \bar{x})^2 \)
In this equation, s2 is the sample variance xi is the sample data set x̄ is the mean value of a sample set of values, and N refers to the size of the sample data set.
Difference between population and sample:
The term "population" refers to the entire number of relevant observations. Analyzing Tokyo's residents' age, for example, would include the age of every Tokyo resident in the population.
A data sample is a collection of data from a population in statistics. The population is typically very large, making it impossible to list all the values in the population.
The solution is to collect a sample of the population and perform statistics on these samples. These samples then reflect the whole population.
How to find the variance?
Calculating variance manually is a tedious task. You will need the mean of the data set, arithmetic difference, and many additions and subtractions to find variance.
You can also use the population variance calculator above to calculate the variance for your set of data. The first example is of population variance and the second example is of sample variance.
Example no 1:
Suppose there are exactly five guest rooms in a hotel. Every room is accommodating the following numbers of people:
x1 = 6, x2 = 5, x3 = 6, x4 = 7, and x5 = 4
Find variance.
Solution:
Let's use the formula for the population variance given above.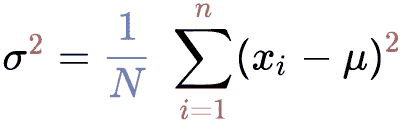
Follow these steps to measure the variance for the given data set using this formula.
Step 1: Find the mean of the data set
Mean \(=\:M\:=\:\frac{\sum \:x}{n}\:=\:\frac{\left(6\:+\:5\:+\:6\:+\:7\:+\:4\right)}{5}\:=\:\frac{28}{5}\:=\:5.6\)
Step 2: Subtract the mean value from every number in data set to find the arithmetic difference.
\(x_1 - \mu = 6 - 5.6 = 0.4\)
\(x_2 - \mu = 5 - 5.6 = -0.6\)
\(x_3 - \mu = 6 - 5.6 = 0.4\)
\(x_4 - \mu = 7 - 5.6 = 1.4\)
\(x_5 - \mu = 4 - 5.6 = -1.6\)
Step 3: Take the square of each arithmetic difference
Get \((x_i - \mu)^2\) for each value.
\((x_i - \mu)^2\)
\((0.4)^2 = 0.16\)
\((-0.6)^2 = 0.36\)
\((0.4)^2 = 0.16\)
\((1.4)^2 = 1.96\)
\((-1.6)^2 = 2.56\)
Step 4: Find the mean value by adding all these values and dividing them by the number of values.
Variance = \(\sigma^2 = \Big\{\dfrac{0.16 + 0.36 + 0.16 + 1.96 + 2.56}{5}\Big\} = \dfrac{5.2}{5} = 1.04\)
Example no 2:
The shopkeeper sold this number of apples every day for seven days: \(42, 48, 30, 36, 46, 53, 62.\). Use this sample data to calculate the sample variance for the number of apples sold per day by a shopkeeper.
Solution:
Step 1: Write the formula for sample variance.
Use the following formula to calculate sample variance when dealing with sample data sets.
Step 2: Compute the mean value for the sample data
\(\bar{x} = \dfrac{\sum x}{n} = \dfrac{42 + 48 + 30 + 36 + 46 + 53 + 62}{7} = \dfrac{317}{7} = 45.28\)
Step 3: Subtract the mean value from each number in the data set
Calculate \(x_i - \bar{x}\), where xi represents the values in the data set.
\(x_1 - \bar{x} = 42 - 45.28 = -3.8\)
\(x_2 - \bar{x} = 48 - 45.28 = 2.72\)
\(x_3 - \bar{x} = 30 - 45.28 = -15.8\)
\(x_4 - \bar{x} = 36 - 45.28 = -9.28\)
\(x_5 - \bar{x} = 46 - 45.28 = 0.72\)
\(x_6 - \bar{x} = 53 - 45.28 = 7.72\)
\(x_7 - \bar{x} = 62 - 45.28 = 16.72\)
Step 4: Take a square of each result from the previous step
\((x_1 - \bar{x})^2 = -3.8^2 = 14.44\)
\((x_2 - \bar{x})^2 = 2.72^2 = 7.40\)
\((x_3 - \bar{x})^2 = -15.8^2 = 249.64\)
\((x_4 - \bar{x})^2 = -9.28^2 = 86.11\)
\((x_5 - \bar{x})^2 = 0.72^2 = 0.52\)
\((x_6 - \bar{x})^2 = 7.72^2 = 59.60\)
\((x_7 - \bar{x})^2 = 16.72^2 = 279.56\)
For each data point in your sample, now you have the value \((x_i - \bar{x}) 2\).
Step 5: Calculate the sum of all values of \((x_i - \bar{x}) 2\)
\(\sum (x_i - \bar{x})^2 = 14.44 + 7.40 + 249.64 + 86.11 + 0.52 + 59.60 + 279.56 = 697.27\)
Step 6: Divide the \(\dfrac{\sum (x_i - x)^2}{(n - 1)}\)
There are seven values in the data set in the sample, so \(n = 7\).
Variance of the sample \(= s^2= \dfrac{697.27}{7 - 1} = 116.21\)
References:
How to calculate variance | wikiHow
What is the Difference Between Population and Sample | Statistics Solutions